STRIVE TECH
Hardware and data product focused on the future of fitness wearables.
Project TL;DR
As the first Product Manager at STRIVE, I had the exciting opportunity to collaborate closely with our CTO, the dedicated development team, and experts in sports science. My role was pivotal in gathering invaluable user feedback, analyzing quantitative data, and leading A/B tests with tools like Maze and Google Optimize. All of this effort culminated in the successful launch of our consumer application's innovative feature: the 'AI Coach
User Research
In our user research, we identified a significant gap: many individual consumers lack direct access to a Physical Therapist or Sports Scientist to interpret surface electromyography data for them. Recognizing this, our primary objective became translating complex data sets into actionable feedback. To achieve this, we engaged 120 test users in a structured research process. We allowed these users to select their preferred workout type and subsequently provided them with tailored end-of-session feedback based on their chosen workout. This approach ensured that each user received relevant and comprehensible insights, bridging the gap between intricate data and practical application.

Ideation
Wireframes
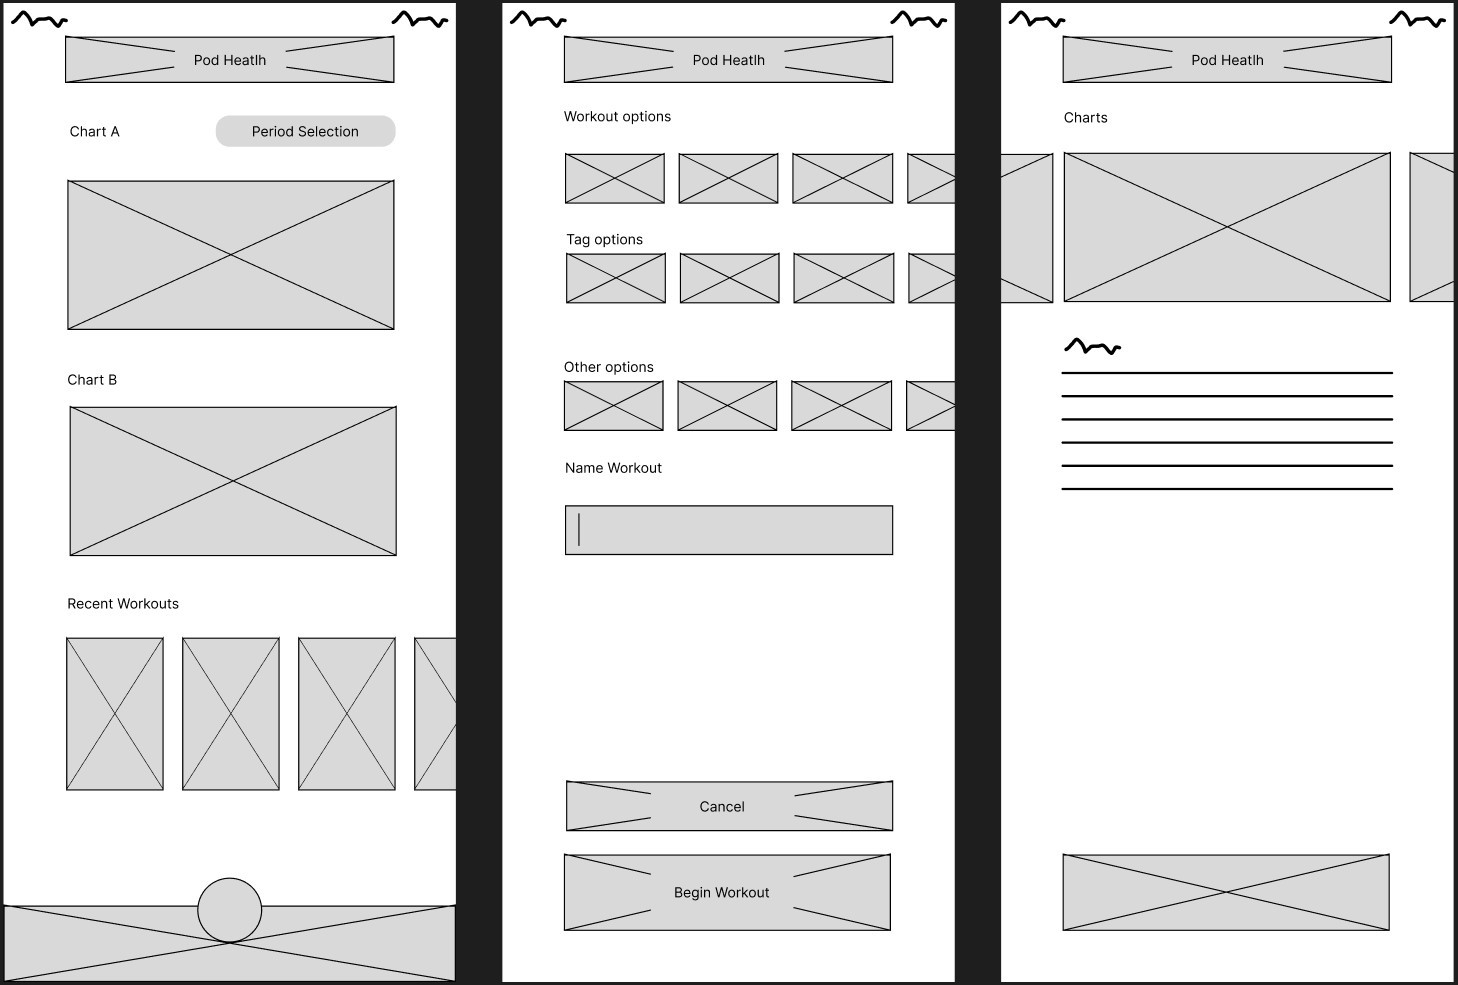
During the wireframing phase, our emphasis was on selection mechanisms and output displays. As our designs evolved, we faced a pivotal decision: presenting data through a single, concise graph versus incorporating a scrollable area for multiple graphs. We realized that introducing a scrollable area for multiple graphs would not only complicate the user experience but also pose challenges in the development phase, particularly in allowing users to focus on specific data points or sections within the screen. Consequently, we opted for a streamlined approach, prioritizing clarity and user-centric design.
Prototyping
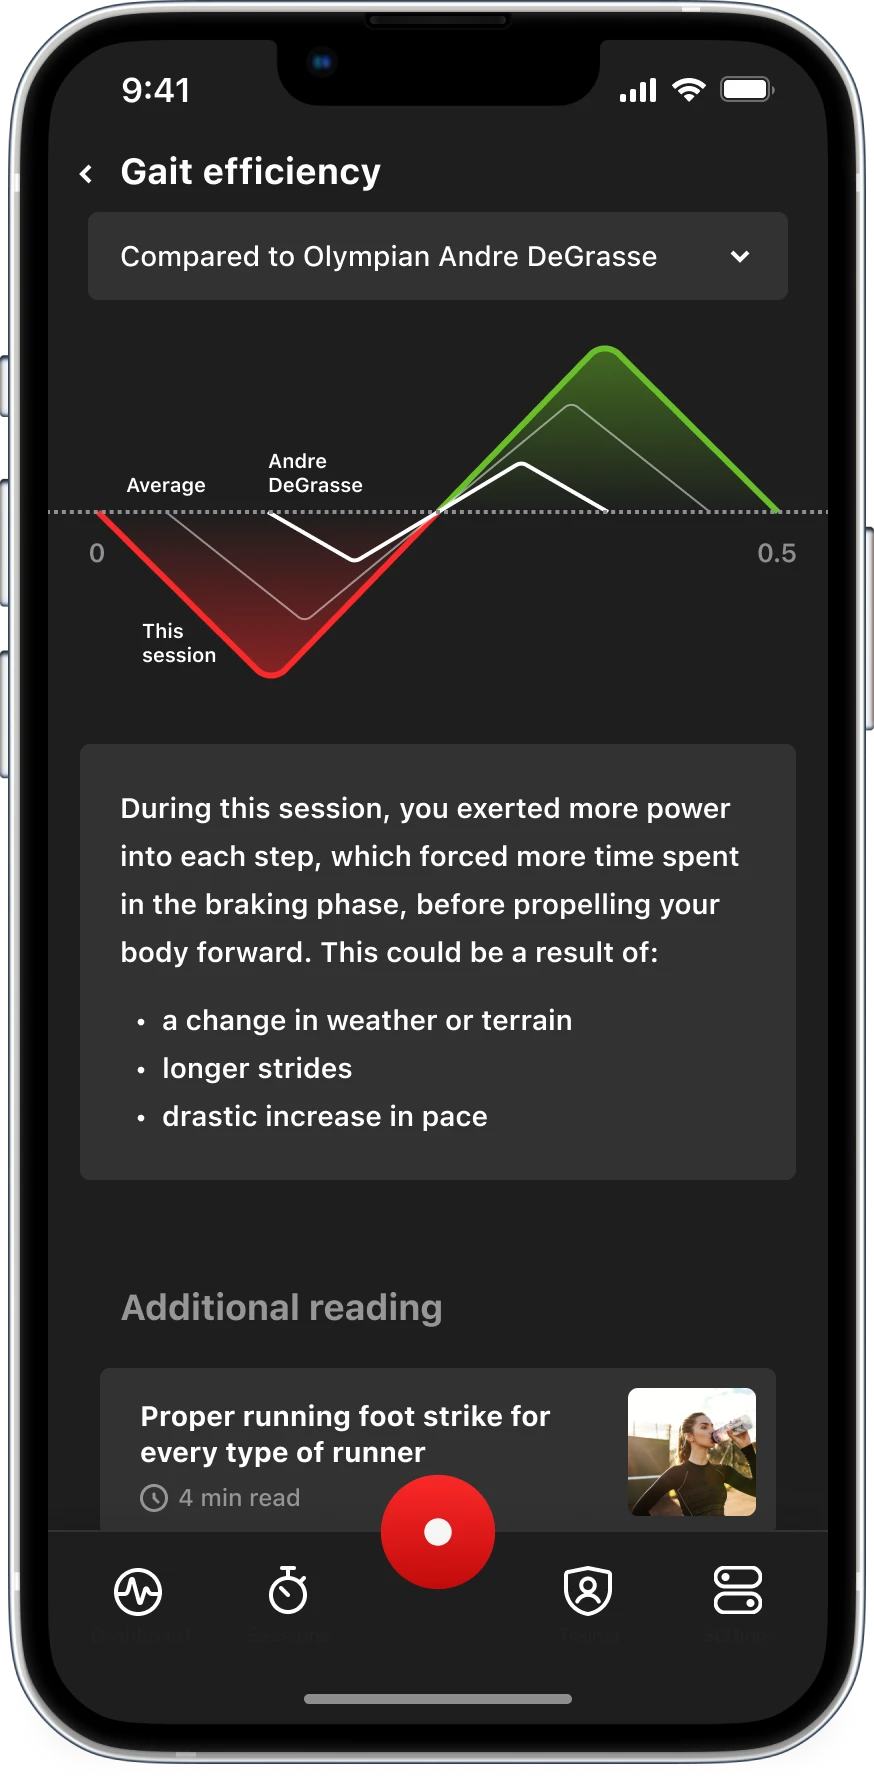
During the prototyping stage, our technical considerations, especially the use of D3.js, steered us towards a design choice: present users with a singular, primary visualization option. As users scroll further, additional graphical representations unfold. These graphs, while offering a snapshot of the workout data, also serve as gateways. A simple click transports users to the detailed data within the app, facilitating a more granular exploration.
To materialize our concepts, we turned to Figma, a powerful design tool that allowed us to craft high-fidelity interactive prototypes. Figma's collaborative environment was instrumental in visualizing the user journey, ensuring that the transition from one graph to another was both seamless and intuitive. For user testing and feedback, Maze was our go-to platform. It provided us with invaluable insights, helping us refine our Figma prototypes to better resonate with user expectations and requirements.

A/B testing
During our A/B testing phase, we embarked on an experiment to optimize user engagement on the post-workout screen. We devised multiple display types and tested them across four distinct groups, each comprising 20 participants. Our primary metric was the duration users spent on their post-workout screen. Over a span of two weeks, we meticulously tracked and analyzed the data to determine which display type resonated the most with users, keeping them engaged and invested in their post-workout insights.