Fraxion
Spend Management solution focused on the midmarket, from request to invoice.
Project TL;DR
At Fraxion, our users rely on exporting data to uncover crucial spend insights, including long-tail expenditures and essential supplier relationships. While other platforms offer these insights directly within their interfaces, our unique approach centers around empowering users to extract these key details through data exports. Upon closer examination of our buyer personas, it's evident that a primary use case involves the export of requests and approvals on a per-team basis. This strategic focus ensures that our users can efficiently access the information they need to make informed decisions and optimize their spending strategies.
User Research
Our user research journey began with a deep dive into the work environments of our users. We sought to understand not only where they operated but also the suite of tools and applications they employed, especially when exporting our data for analysis. This initial step helped us gain insights into their current workflows and needs.
Following this, we delved into the types of reports our users were generating from these exports. A pivotal discovery emerged: Excel and Power BI stood out as the primary tools of choice. Armed with this knowledge, we embarked on a journey to explore the feasibility of developing our own customizable implementation. The goal was to empower users with extensive customization options.
However, upon thorough evaluation, we aligned with the reality that building such a comprehensive solution came at a significant price and time investment. Recognizing the imperative to align with our business needs efficiently, we opted to make an informed decision to acquire an existing solution. This decision allowed us to effectively meet our users' needs while ensuring our resources were allocated optimally.

Ideation

Research and Selection
Having gained insights into our users' workplaces and workflows, we transitioned into a meticulous vendor selection process aimed at achieving optimal consistency and control. Given our reliance on the Azure ecosystem, Power BI emerged as the standout choice due to its seamless integration with our existing tools and infrastructure.
With Power BI secured as our reporting solution, we shifted our focus to crafting the right reports for our end users. This phase involved in-depth research to identify the specific reports that would best serve the needs of our user base. By aligning our technology choices with our users' requirements, we ensured that the reports we delivered were not only technically robust but also highly relevant and valuable.
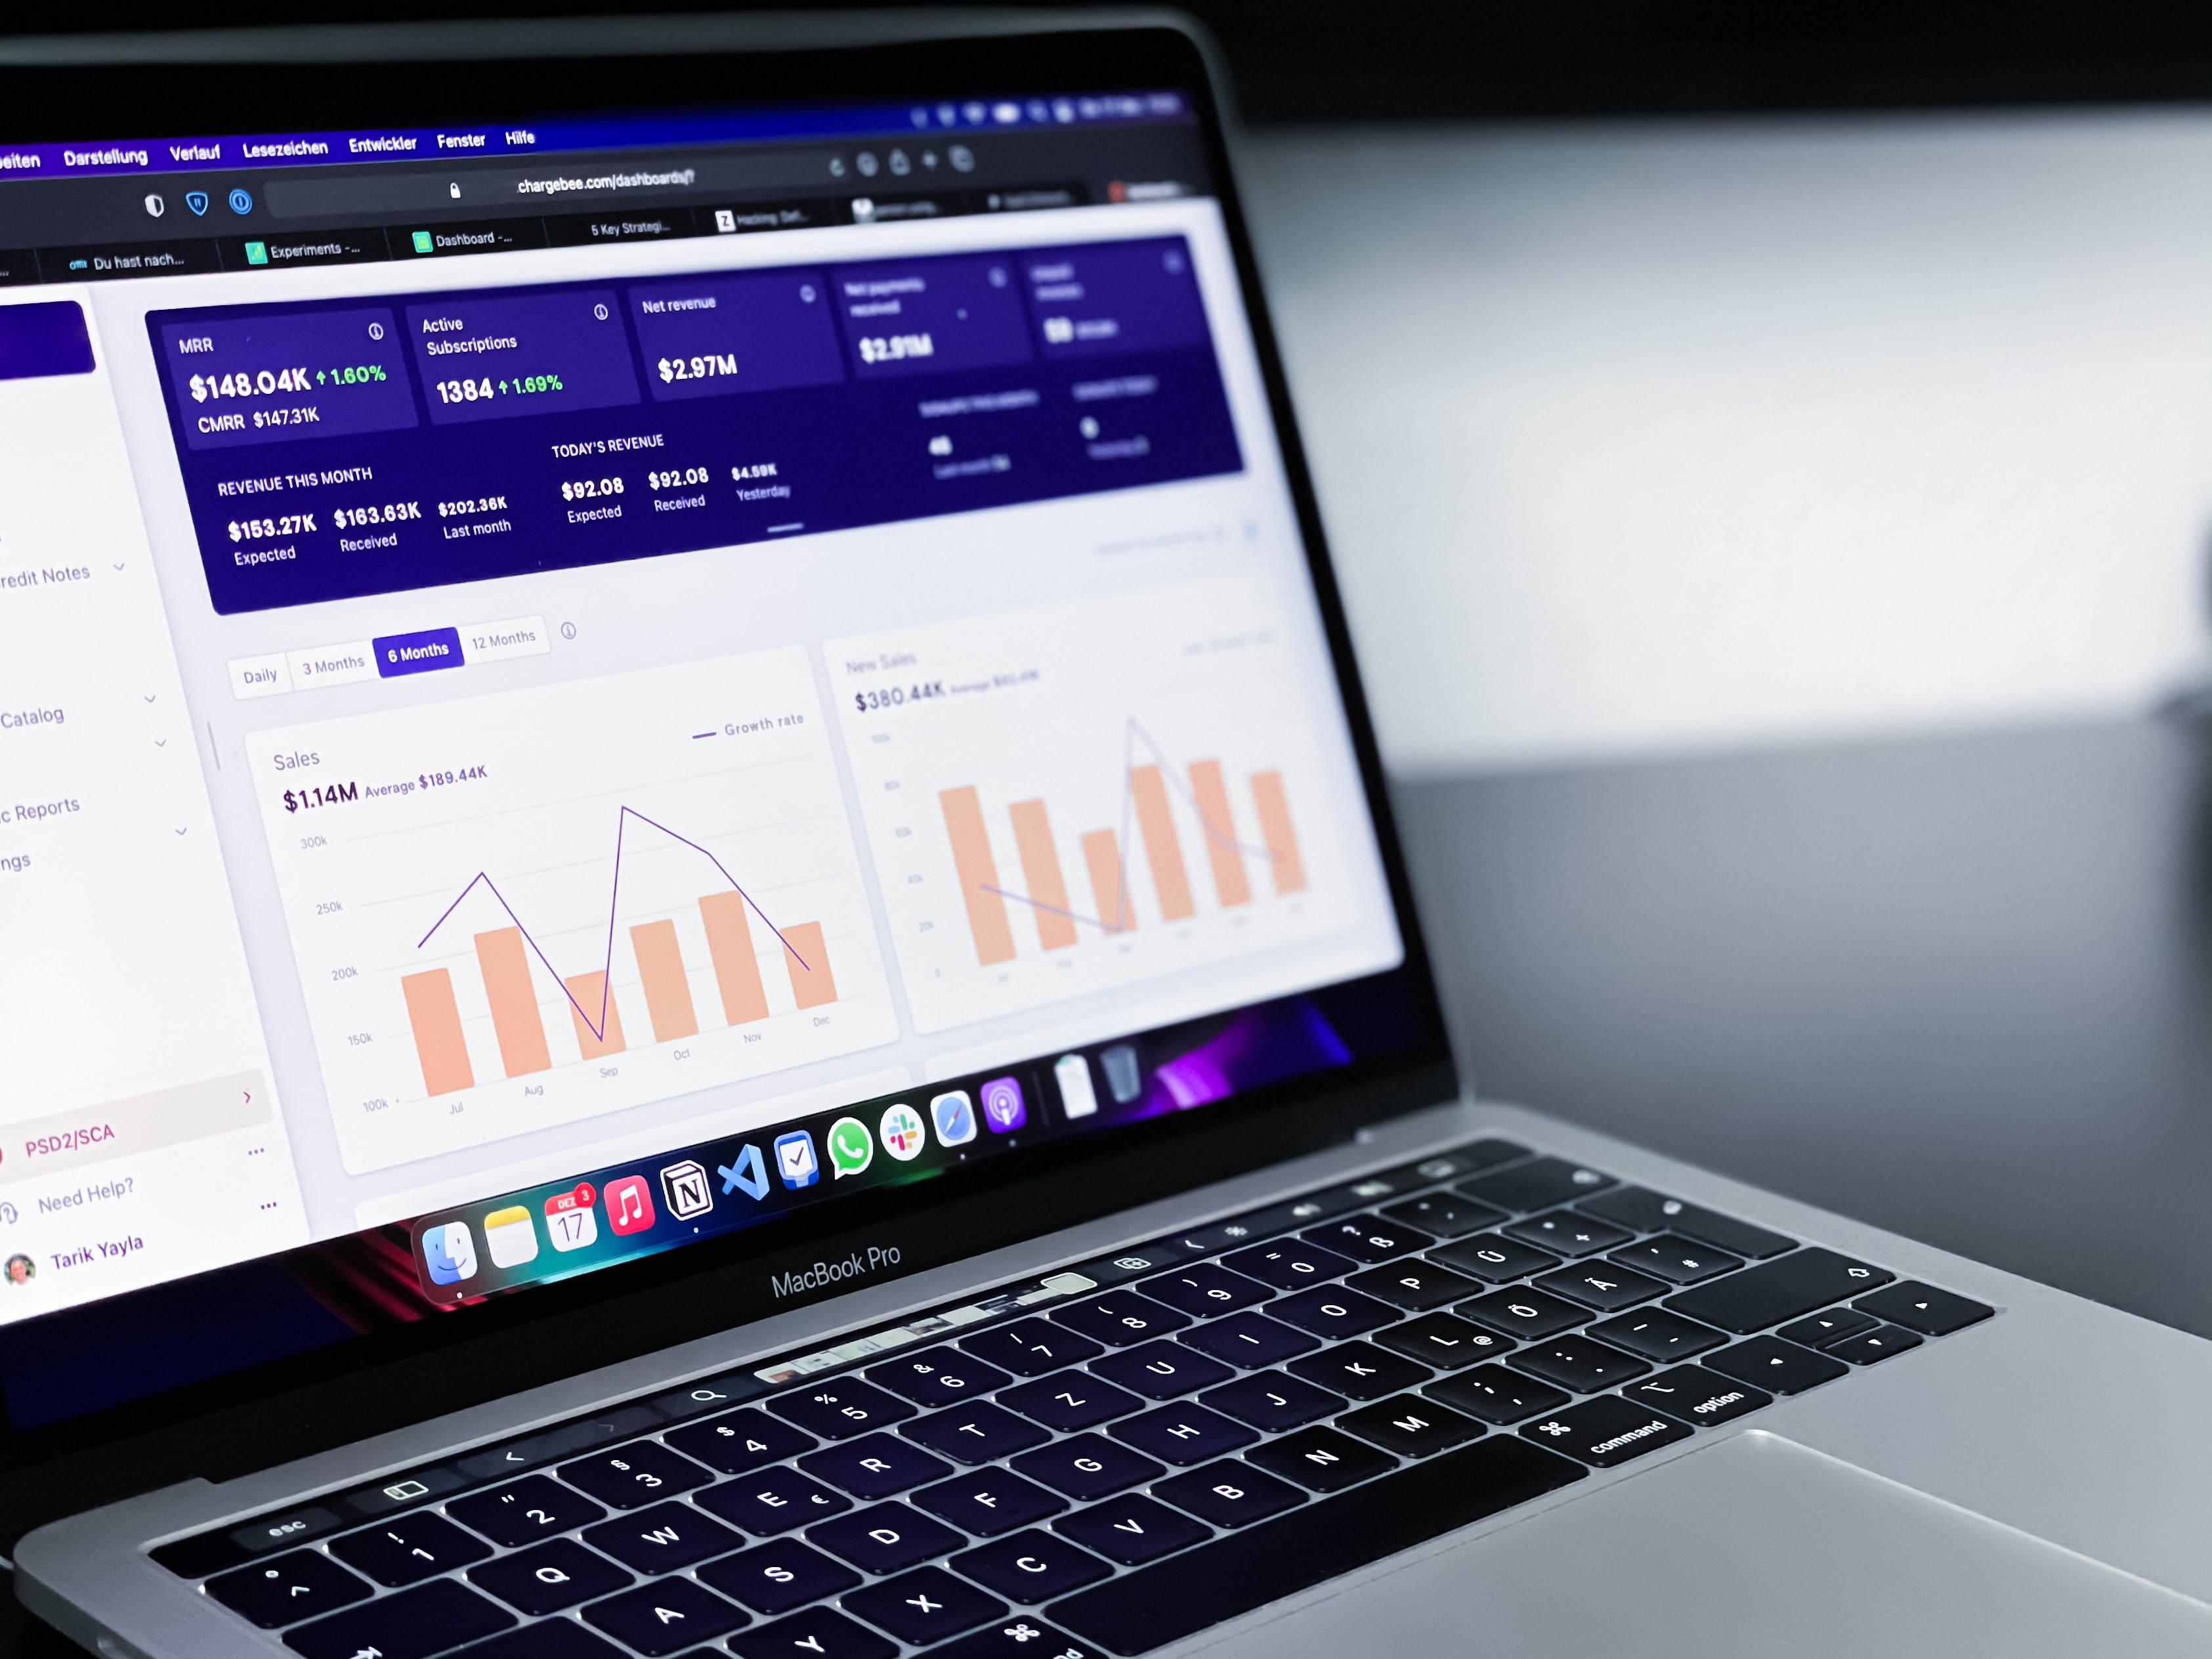
Graphs, charts, and big numbers
An integral aspect of this project revolved around determining the most effective way to present data for optimal readability and ease of scanning. A significant effort was dedicated to iterating on various approaches for displaying key figures, such as the 'total spend,' in a manner that would maximize impact. This iterative process involved refining how these figures were visually presented to ensure they immediately captured users' attention and conveyed critical insights.
Furthermore, we delved into the question of what data should be filterable and how best to implement these filters. This exploration encompassed defining the most intuitive and user-friendly options, such as slicers or dropdown menus, that would enable users to seamlessly interact with the data. By meticulously designing these interactive elements, we aimed to empower users to swiftly extract specific insights tailored to their needs
Report Selection
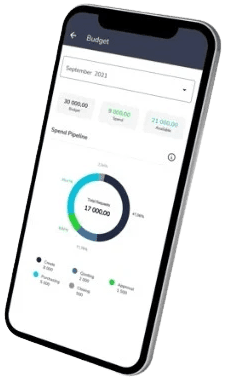
As we embarked on the process of selecting reports, we recognized the importance of ensuring a seamless experience for end users accessing our platform through the mobile app. With this in mind, we placed a strategic emphasis on crafting reports that could be effectively condensed for mobile viewing. This approach aimed to empower users to glean key insights even while on the go.
In the culmination of our selection process, we meticulously identified seven reports that not only met the criteria for mobile compatibility but also offered the depth and detail necessary for comprehensive analysis. These chosen reports were designed to provide a rich experience on the web app while ensuring a well-supported and meaningful presentation on the mobile app. This careful curation ultimately struck a balance between accessibility and depth, catering to users across different platforms.

Single Ease Question (SEQ)
We engaged 60 external users and an additional 30 internal users in a task: find a specific piece of data within the same report. This exercise aimed to gauge whether our report layouts and standards achieved simplicity or were overly complex.
Upon analyzing the results, a notable trend emerged. Out of the seven reports evaluated, two presented significant challenges for users attempting to locate the required data. These findings highlighted the importance of refining and streamlining these specific reports to enhance user accessibility and align the layout with user expectations.
Outcomes
Within a span of 6 months, the launch of Insights proved instrumental in driving tangible results. It played a pivotal role in sealing deals totaling $40k from a prospective pipeline deeply interested in Procurement analytics. Additionally, we achieved a substantial migration of $240k worth of business from our legacy product to the subscription-based offering.
Over the subsequent 9 months, our strategic initiatives yielded remarkable outcomes, culminating in a 12% increase in Annual Recurring Revenue (ARR). This growth was a product of a combination of ongoing upgrades for existing customers and the acquisition of new clientele.
Throughout this journey, we discovered that a focused approach to reporting proved most effective. While services reports didn't perform as anticipated in terms of sales, they still maintained their significance by offering a distinctive feature within the Fraxion Spend Management suite. These findings reinforced our commitment to refining our offerings in alignment with evolving market dynamics.